Quantum Mechanics and Spectroscopy- Orbital Plotting on a Computer
Orbital Plotting on a Computer
Spectroscopy in Large Lecture Halls
Thermoluminescent Sodium Chloride
Calculating Wave Functions
Particle in a Box
Moving Liquids With Electricity
Potential Energy Surface Model
Models 360
NMR Program
Crooke’s Tube
Orbital Models
Hydrogen Charge Clouds
Showing Wave Patterns With a String
Electroscope
Optical Extinction
Orbital Plotting on a Computer
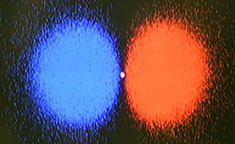
Description: An IBM program developed by Professor Frank Weinhold that draws atomic and molecular orbitals as dot-densities, contour maps, or surface plots.
Source: Professor Frank Weinhold
Year: 1988 Vol: N/A Page: N/A
Rating: 


Hazard: Low
- Electrical shock hazard
- Model or simulation
Effectiveness: Average
- Indirect observation
- Simulation
- Good connection from demo to course material
- Time to results is medium
- Results are perceivable with guidance
- Mild effects are seen by audience
- Good reliability
Difficulty: Medium
- Simulation
- Prior practice recommended
- Some intermediate steps to results
- Demos in which a display is used
Safety Precautions:
- Use of UL approved three-prong plug and outlet required
- Eye protection required
Class: Simulation, Atomic Structure, Quantum Mechanics
Division: General, Inorganic Chemistry, Physical Chemistry
Return to Physical Chemistry Demonstrations